MasterclassesPodcasts

How to Measure Customer Experience with Leading vs. Lagging Indicators: CX Mini Masterclass – E32

By March 21, 2019 March 7th, 2026 No Comments
This CX Mini Masterclass explains the role of leading and lagging indicators in measuring customer experience. Show host and customer experience expert, Julia Ahlfeldt, shares examples for how you can build a balanced view of customer experience with the right mix of CX metrics and measures. If you are wondering how to move beyond a one-metric view of CX, this episode is for you.

How to Measure Customer Experience Holistically: A Balanced Approach

When organizations begin monitoring and evaluating customer experience, there is a natural tendency to latch onto one number. Often this number is one of the 3 most popular mainstream CX metrics: CSAT, NPS or CES. These metrics are useful, but they have their limitations, and it’s unrealistic to assume that you can understand the full picture of CX through just these number s alone.

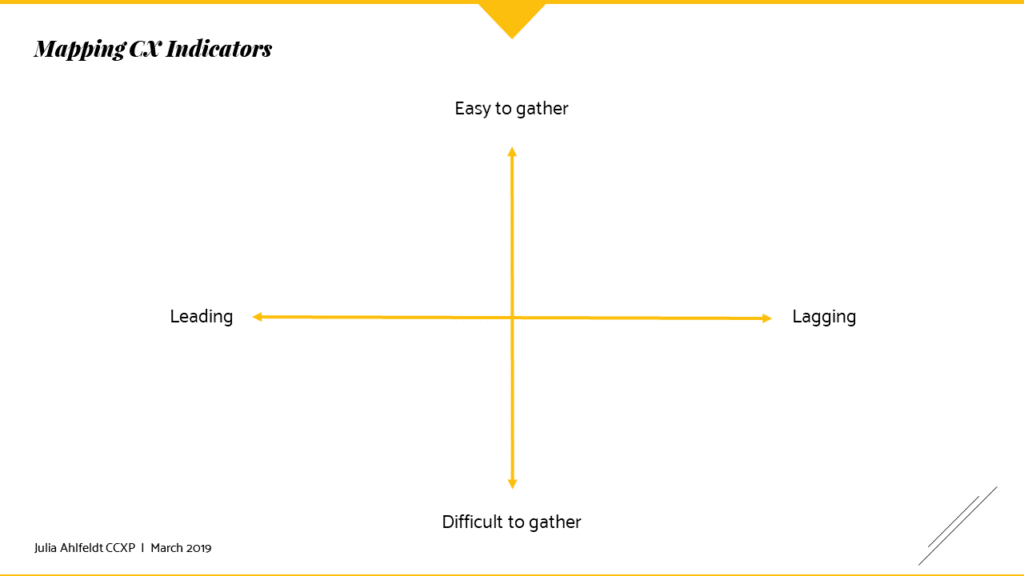
Organizations should track and evaluate their CX performance through a number of metrics and measures that can be brought together to create a more comprehensive view. I recommend creating this holistic view through a combination of leading and lagging indicators.

What Are Leading and Lagging Indicators in Customer Experience?

So what are leading and lagging indicators?

  • Understanding Leading indicators in CX
    • What are they: measures that precede or feed into a customer experience. These should indicate whether or not an experience will be successful. If we think of customer experience like baking a cake, these would be your inputs or ingredients.
    • Examples: wait time, processing time, product availability, system downtime, product quality – these are all things that might contribute to customer experience
    • How can they be used to manage CX: leading indicators help predict the outcomes of experiences and many of them can be measured and monitored before experiences even happen. These can be used to proactively intervene when experiences start going sideways. Additionally, these measures can be leveraged to set department or individual KPIs for teams that operationally contribute to experiences.
  • Understanding Lagging indicators in CX
    • What are they: metrics or measures that happen after a customer experience. These should indicate whether or not an experience was successful. These indicators would tell us whether or not the cake was delicious and possibly how that impacted our relationship with the person we fed it to.
    • Examples: customer satisfaction (CSAT), net promoter score (NPS), customer effort score (CES), first contact resolution, customer retention, average spend – these are all things that might come out of or be affected by a specific customer experience
    • How can they be used to manage CX: lagging indicators help us understand “how we did”. The experience happened and is in the past, but we can use these indicators to evaluate the result and the impact. Lagging indicators are important for monitoring progress (i.e. over time you would want these metrics to improve), and for tracking the impact of customer experience efforts. Lagging indicators such as retention and spend can be especially helpful for tying CX back to business value.


Use this template to map your 5 most important leading and lagging indicators. Ease of gathering can help you prioritize.


Measuring customer experience impact and CX ROI

If you want your CX leading and lagging indicators to really resonate with business leaders, consider linking these to business impact. Believe it or not, your existing indicators can be used to calculate CX ROI. For more on this, including examples and guidance on how to measure the business impact of CX, be sure to check out my Ultimate Guide to the ROI of Customer Experience.

Linking Customer Experience Metrics to Business Impact and ROI: Quick FAQ for Leaders
  • What is the best way to measure CX performance? Start by identifying the inputs for your customer journey analytics. These will be unique to each situation, but should ideally include a mix of leading and lagging indicators. Next, clarify your desired customer outcomes through customer satisfaction benchmarking. Identify metrics or measures that indicate the success or failure of customer journeys in terms of customer outcomes (these are your lagging indicators). Then map the processes that contribute to customer outcomes, and identify the measures that track whether or not these processes are working. (these are your leading indicators).
  • How do CX metrics connect to financial performance? Customer outcomes can often be linked to customer actions that impact the business bottom line. E.g. Customers who experience a seamless onboarding process are more likely to repurchase. Additionally, leading metrics such as error rates, drop offs, etc., may also have efficiency implications. Assess your leading and lagging indicators through the lens of “how does this eventually impact the business”.
  • Which CX indicators are most predictive of business success? The magic question! In my experience with CX ROI tracking, I’ve found that propensity to repurchase, as well as Customer Lifetime Value (CLV) are highly predictive of business success.

Episode transcript

Read transcript

Welcome to Decoding the Customer, a podcast about customer experience and how to realize customer-centric change in today’s dynamic business world. I’m Julia Ahlfeldt, certified customer experience professional, business advisor, and host of this program. Today’s episode is a rebroadcast of one of my favorite episodes from the archive. I’m currently on a little hiatus from posting new episodes, but I’ll be back soon.

In the meantime, I’ve promised to periodically share some of the best of the 90 episodes I’ve published since starting the podcast back in 2017. I hope that you enjoy the highlight reel. This episode is part of my CX Mini Masterclass series here on Decoding the Customer. These weekly episodes are published each Thursday and designed to be punchy, bite-sized overviews of key customer experience concepts and ideas for how you can help your organization thrive through customer centricity.

Whether you’re new to the field of customer experience, are preparing for the CCXP exam, or are a seasoned professional looking to brush up on a few basics, this series will help you improve your knowledge, skills, and performance to stand out as a CX professional. This is episode 32. For the month of March, my Mini Masterclasses have been exploring CX metrics and measurement. It’s a very important topic for those of us working in the field of customer experience.

Metrics and measures help customer experience professionals demonstrate progress and are a way to tie results back to value within the business. In episode 31, I explained three of the most common CX metrics, CSAT, NPS, and customer effort score. These metrics alone only give us a tiny window into the success or failure of a customer experience. In this episode, we’re going to look into how you can use leading and lagging indicators to create a more balanced and robust view of customer experience.

If you’ve been wondering how to help your leadership team move beyond a one-dimensional obsession with CSAT or NPS, stay tuned. If you happen to be out enjoying the start of spring in the Northern Hemisphere or soaking up the last rays of summer in the Southern Hemisphere, and here’s something that you’d like to remember later, don’t worry about writing it down. As always, you can find an overview of the key concepts that we’ve covered today in the show notes for this episode, which are on my website, juliaahlfeldt.com or decodingthecustomer.com. Right, let’s dive into leading and lagging indicators.

Measuring and evaluating customer experience is like understanding someone’s health or the overall success of a business. It’s unrealistic to assume that we can understand the full picture with just one number. We wouldn’t dream to presume that we could understand someone’s health by just taking their temperature. And we definitely wouldn’t assess a company’s success by just looking at their revenue.

Likewise, with customer experience, we need to understand a variety of performance indicators to assess if an organization is providing experiences that meet customers’ needs and expectations and to keep tabs on what’s working versus what’s not with the way those experiences are managed. I think it’s quite helpful to look at these in terms of leading and lagging indicators, acknowledging that you have to balance both. Leading indicators are the factors that contribute to a good or bad customer experience. These are things that precede or feed into the experience.

So for example, if you’re a grocery store chain and you know that customers don’t like long wait times, you could infer that minimal time spent queuing for checkout would be a leading indicator for the success of an experience. Similarly, the operational factors that dictate wait time, like the number of cash registers that are open or the overall speed of checkout would also be leading indicators, as these precede and contribute to the experience. Leading indicators are important because they help you clarify your recipe for success. Once you know what customers do and don’t like about experiences, which by the way is something you should ask them and not just assume you know, you can use this information to identify the factors that drive experience outcomes.

Leading indicators can then be used to proactively mitigate the impact of negative experiences. For example, an alert to preemptively notify customers of an extended waiting period, or a way for a business to monitor and manage operational workflows before long wait times even become an issue. Leading indicators are often easy to connect back to business operations, so they’re a great way to get the broader organization to think about their contribution to the customer experience, to set department level KPIs that are related back to experiences, and to get people rallied around common goals. Then we have lagging indicators.

These are the outcomes or results of the customer experience, which are usually measured after the fact. Think of it this way. At this point, the cake is baked, but lagging indicators will tell you whether or not the cake was delicious. Some of the most common customer experience metrics, CSAT, NPS, and customer effort score, are all lagging indicators.

If you’re interested in the definitions of these, be sure to check out episode 31. But in a nutshell, these three very popular CX metrics will tell you after the fact, how a consumer perceived the experience or their overall relationship with the brand. If we say with our grocery store example, a customer who experiences an extraordinarily long wait time at checkout might respond to a CSAT survey with a low level of satisfaction. In this case, the lagging indicator would reflect their disappointment with the experience.

And a quick side note on one of those three most popular customer experience metrics, Net Promoter Score. I’m planning an episode fully dedicated to this topic, but it bears mentioning here that Net Promoter Score can be particularly tricky as a lagging indicator to use in correlation with a specific experience. Because a consumer’s response to the NPS survey question, which asks about likelihood to recommend a brand, will normally draw on multiple experiences or interactions. These popular customer experience metrics evaluate customer perception, but there are many other lagging indicators that don’t rely on surveying customers.

In our grocery store example, we could capture the number of customers who abandoned their cart or leave the store without making a purchase. We could also evaluate the frequency of repurchase and other behavior-based measures that tells the result of the experience. The key point here is that these lagging indicators are used to tell you how you did, and we don’t always need to pester the customer with a survey to find this out. Ultimately, we want to see gradual improvement with our lagging indicators, as customer experience initiatives turn into better experiences for customers and make customers happier.

But to get there, we need to understand the recipe for good experiences so that we can help organizations deliver this. If leading indicators are tracked in real-time, organizations can use this information to flag and intervene when it looks like an experience might be going sideways. If you’re a CX professional working in an organization that currently measures customer experience, I’d encourage you to sit down with your team and identify your top five leading and top five lagging indicators. Reflect on what these numbers tell you and if you think they’re providing the complete story.

If not, then grab your journey map, identify your drivers of success or failure, and figure out how to measure both the inputs and outputs of this. To help you through this process, I’ve included a simple visual in the show notes for this episode. This visual clarifies the distinction between leading and lagging indicators and can be used as a reference for a team discussion about your top five. So there you have it, my overview of leading and lagging indicators.

If you’re enjoying the show, please share the program with others who might be interested or head on over to iTunes and rate the podcast. This helps others find the show. I’ll be back next Thursday with another CX Mini Masterclass. We’re sticking with the topic of CX metrics and measures, so tune in then or subscribe to the show for updates when new episodes go live.

And if you’re keen to do some more intensive online training in the field of customer experience, then I’d encourage you to check out CX University. They offer a broad array of e-learning options that you can access anywhere and anytime. Their offering includes practice tests for the CCXP exam, and they’re a Customer Experience Professionals Association accredited resource and training provider, meaning that their materials have been reviewed and vetted by the association for alignment with the six core competencies that are in the exam. And what’s better is that all of this is available on a flexible monthly subscription plan, meaning that you don’t have to fork over hundreds of dollars to get started.

As of the time of publishing this podcast, plans including CX courses and practice exam questions start at just $75 per month. Listeners of this show can use the discount code Podcast10 to get 10% off the first month subscription and help support the show. I’ll catch you next Thursday, but if you’d like to get in touch in the meantime, you can send me an email, tweet, or LinkedIn message. My handle is at Julia Ahlfeldt and my full contact details are also listed on my website, juliaahlfeldt.com or decodingthecustomer.com.

Want to keep learning about CX?

If you’d like to checkout more of these CX Mini Masterclasses or listen to my longer format CX expert interviews, check out the full listing of episodes for this CX podcast.

Decoding the Customer is a series of customer experience podcasts created and produced by Julia Ahlfeldt, CCXP. Julia is a customer experience strategist, speaker and business advisor. She is a Certified Customer Experience Professional and one of the top experts in customer experience management. To find out more about how Julia can help your business achieve its CX goals, check out her customer experience consulting services  (including journey mapping, CX strategy development, experience innovation, leadership workshops and CX ROI measurement) or get in touch via email


Julia Ahlfeldt

Author Julia Ahlfeldt

More posts by Julia Ahlfeldt